 When is a good time to buy? Buy low and sell high, that’s what I was always taught! It isn’t always quite that easy though… especially when your talking about your home. The classic market trend from year to year is that prices increase at the beginning part of the year and then correct in autumn and winter. If this year is to follow that […]
Frost Warning
 Its that time of year again when it pays to be vigilant when it comes to the cold and more importantly frost and ice! Its not anywhere near cold enough to freeze at the moment but the weather may turn soon, below are a few tips that might help save you a burst pipe or frost issue. If your property is empty make sure […]
Move Home With Just 5% Deposit
 Move home with just 5% deposit How help to buy can help you. The help to buy mortgage guarantee scheme can help you move home with as little has 5% deposit. Some key facts on the mortgage guarantee scheme. Available to all buyers first-time buyers and existing home owners. Available on all existing homes and newbuilds. Applies to properties up to the value of £600,000. […]
Autumn Is On The Way
 I saw this this at breakfast and it made me think… Autumn is on the way…… But that does men that there is time for one last push to get your property sold before Christmas! In my experience this can actually be one of the most productive times of the year, as there is an imminent time scale that all parties are working towards. […]
How Have Property Prices Changed Over The Last 10 Years?
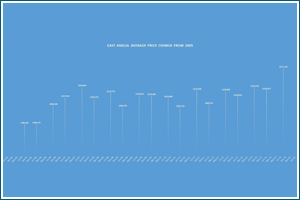
 How have property prices changed over the last 10 years? Well in short they have gone up! Have a look at this chart to get a better understanding on how they have fluctuated. Basically prices have been stuck in a range for a very long time and only in the last few months have they managed to break higher. Click on the picture to see how […]
Your Are More Likely To Sell With The 2nd Agent
 It is an accepted statistic that between 30% and 40% of new instructions each month will sell. This means that as time moves on between 60% and 70% of properties on the market each month have not sold. Rightmove.co.uk have confirmed that overall you are more likely to sell with the 2nd agent. This highlights the fact that some agents, over price properties to gain instructions and don’t always give the best […]


